Lecturer: Dr Stephen Millmore
This course covers the techniques required to produce meaningful, informative scientific plots. Such techniques can improve the readability, and thus audience engagement, with papers and theses. The first few lectures of the course focus on the general technique required, and are suitable for a general audience. Following this, additional lectures are given for a specific software package for visualising computational fluid dynamics simulation data, VisIt. This software is widely used in the Laboratory for Scientific Computing, and offers powerful visualisation capabilities, and these lectures are suitable for students on the continuum stream.
Students should leave the course knowing:
- how to present data to a variety of audiences conveying maximum information
- the requirements for meaningful, accessible presentation of results
- if on the continuum stream, how to use VisIt for two- and three-dimensional simulation results, including multiphysics applications.
Lectures:
- Data visualisation part 1
Representation of data on a plot in 1D, 2D and 3D, ensuring that it is readable and informative. An introduction to a specific plotting software is included (gnuplot) to ensure all plots can be reproduced - Data visualisation part 2
Controlling the information on the plot, including axes, colour schemes and labelling. Colour mapping, contours, side-by-side comparisons and accessibility are all considered, and some advanced features for plotting in gnuplot are introduced.
Practicals
The use of VisIt is introduced entirely through a two-hour practical. This practical considers:
- An introduction to VisIt
- Colour maps and contour plots
- Mesh and mesh refinement
- Techniques for 3D plots
- Python scripting for VisIt
Prerequisites:
- None
Required course for:
- None, though strongly recommended for continuum stream written assignments
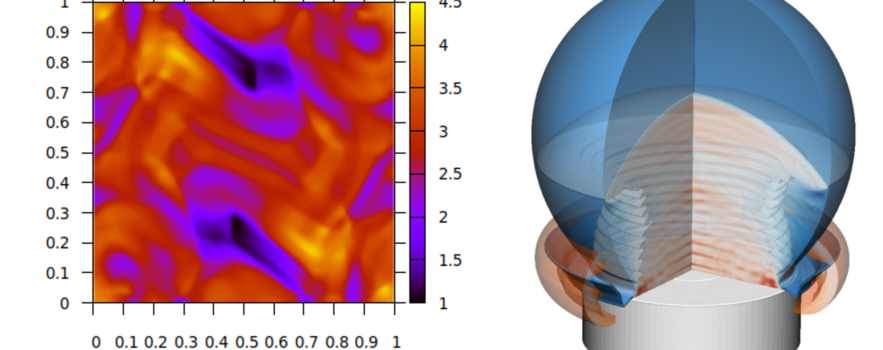
Picture credit:
Stephen Millmore